In de methoden die het RIVM gebruikt om het verloop en de interventies van COVID-19 te modelleren, wordt uitgegaan van immuniteitsopbouw en is geen ruimte voor containment met test/trace/isolate – terwijl veel landen aantoonbaar succes hebben met een containmentstrategie en er van effectieve immuniteitsopbouw geen sprake is.
Jorrit Posthuma de Boer is als chemisch ingenieur in zijn eigen vakgebied zeer bekend met dergelijke modelleringen, en legt in dit artikel uit hoe de RIVM-modellen werken, en welke zwaktes deze vertonen. Dit artikel is gebaseerd op deze Twitter-draad, en heeft als voornaamste bron deze PowerPoint en deze PowerPoint, behorend bij de presentaties van Jaap van Dissel op 18 maart en 25 maart in de Tweede Kamer.
Merkwaardig model
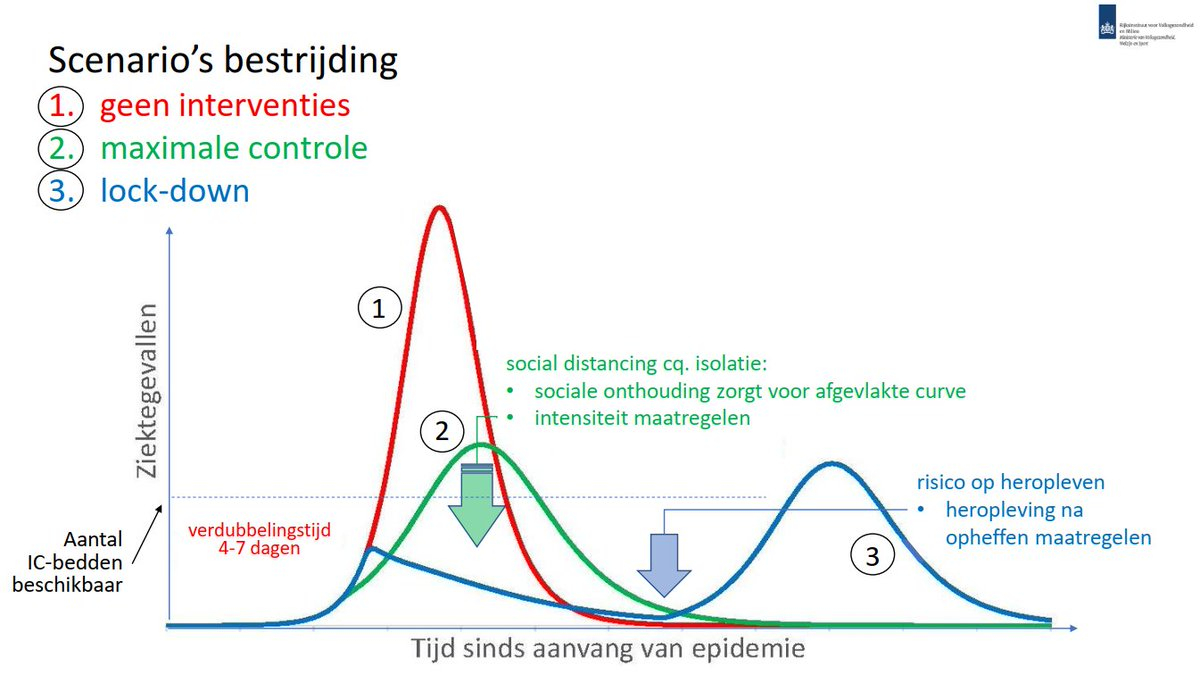
Tijdens de briefing aan de Tweede Kamer presenteerde Jaap van Dissel, directeur van het Centrum Infectieziektenbestrijding van het RIVM, op slide 7 van zijn PowerPoint-presentatie drie scenario's voor de aanpak van het coronavirus, tot stand zijn gekomen op basis van modellering.
De resultaten zijn enigzins merkwaardig: de staart van het 'geen interventies'-scenario (de rode lijn) loopt veel steiler naar beneden dan die van het 'lock-down'- en het 'maximale controle'-scenario. Dit is vreemd!
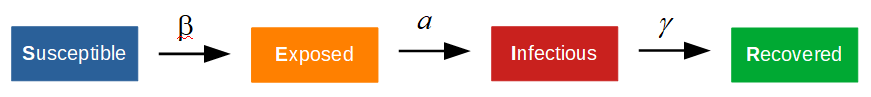
Voor epidemiologische modellering wordt veelal een SEIR-model gebruikt. Hierin staat:
- S voor het aantal personen die vatbaar voor de ziekte zijn (‘Susceptible’), i.e., het aantal personen dat nog niet immuun is voor de ziekte;
- E voor het aantal personen die op enig moment geïnfecteerd zijn geraakt (‘Exposed’);
- I voor het aantal personen die besmettelijk zijn (‘Infected’), i.e., de ziekte aan anderen kunnen overdragen;
- R voor het aantal personen die hersteld en immuun voor de ziekte zijn (‘Recovered’).
Schematisch ziet dit model er als volgt uit:
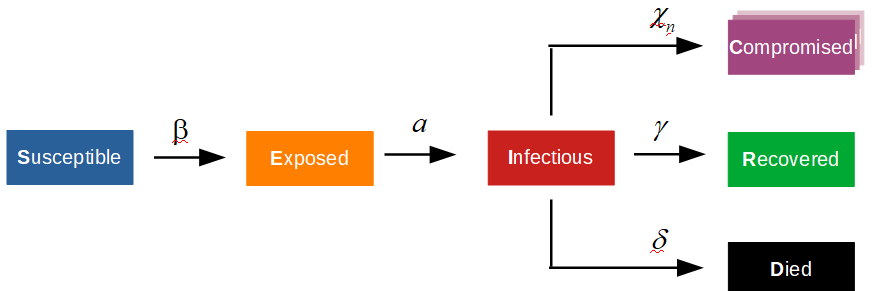
Het model maakt niet direct zichtbaar dat er personen zullen zijn die blijvend letsel aan de ziekte zullen overhouden
Het SEIR-model is een simplificatie. Maar belangrijker nog: dit model geeft niet de consequenties weer die een ziekte kan hebben. Het model maakt niet direct zichtbaar dat er personen zullen zijn die blijvend letsel aan de ziekte zullen overhouden en daardoor arbeidsongeschikt raken en/of blijvend zorg nodig zullen hebben. Dit zal maatschappelijke kosten met zich meebrengen, waaronder langdurige zorg.
Tevens kunnen er personen aan een ziekte overlijden. Voor beleidsmakers is het van belang dat ook deze 'neveneffecten' van een ziekte inzichtelijk worden gemaakt. Dit is mogelijk met het hieronder weergegeven model, waarin ook blijvend letsel in gradaties ('Compromised') en sterfte ('Died') wordt meegenomen.
Terug naar slide 7 (18 maart 2020). Het is vreemd dat het 'geen interventies'-scenario steiler afloopt dan het 'lock-down'-scenario. Blijkbaar gaat het RIVM er vanuit dat er een immuniteitsfeedback zal optreden, waardoor de ziekte overdracht sterk wordt geremd.
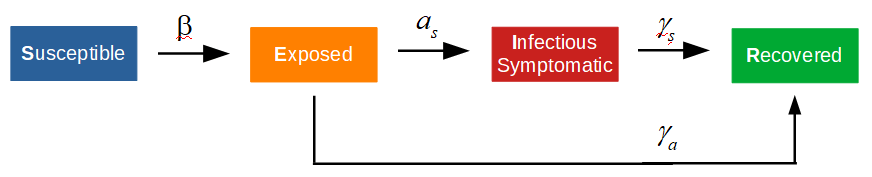
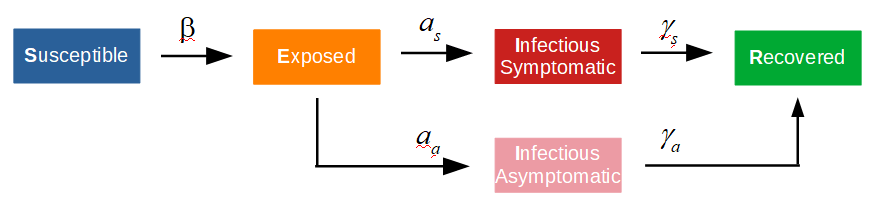
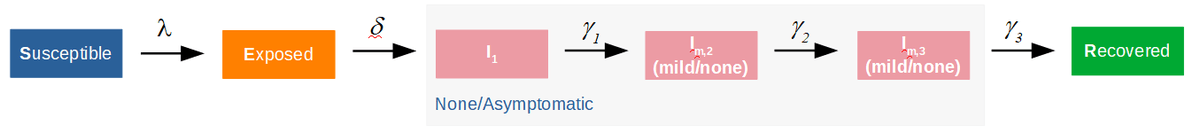
Gaat het RIVM in haar modellering uit van een parallele transmissie-route via asymptomatische besmetting? Zoals in het onderstaande model staat aangegeven:

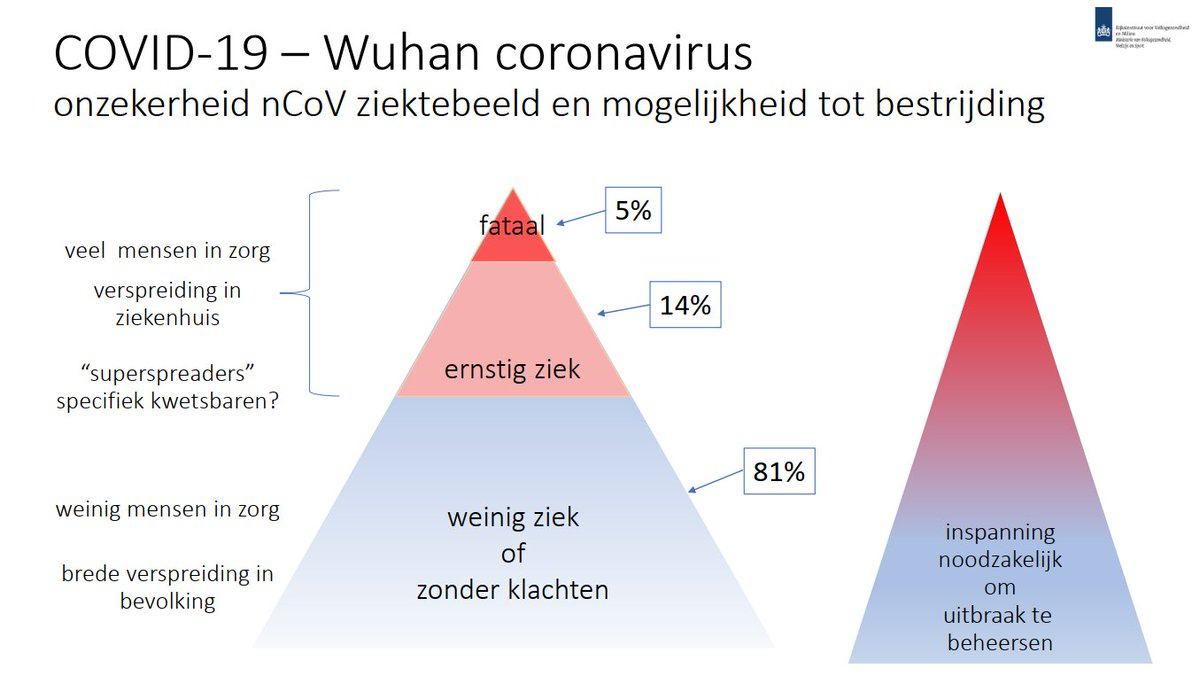
Indien men uitging van de aanname dat asymptomatische besmetting minder snel verloopt dan symptomatische besmetting, dan wordt een groepsimmuniteitsstrategie namelijk heel aantrekkelijk. Dit is te zien in slide 3 (18 maart), waarin de infectiepyramide werd gepresenteerd. Voor 81% van de geinfecteerde personen werd namelijk een 'asymptomatisch' ziektebeeld verwacht.
Wordt ervan uitgegaan dat alleen druppelinfecties aan de ziekteoverdracht bijdragen, dan kan het model verder worden versimpeld. Dit aangezien 'asymptomatische' besmetting niet meer bijdraagt. Er zijn nu twee routes die het aantal geïnfecteerden (E) naar beneden trekken.
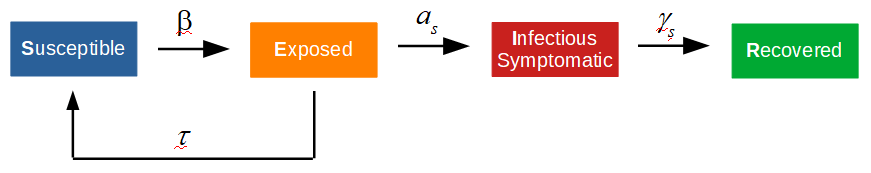
Hierdoor zullen er minder besmettelijken (I) zijn die aan de ziekteoverdracht bijdragen, i.e., de ziekteoverdracht wordt geremd. Dit vooral als de parameter 'a_s' significant kleiner is dan 'gamma_a'. Echter een 'track-trace-isolate'-scenario lijkt initieel analoog, aangezien in dit scenario ook personen uit het 'Exposed'-reservoir worden ontrokken, waardoor de ziekteoverdracht wordt geremd. Echter, deze ontrokken personen worden niet immuun ('Susceptible').
Het 'track-trace-isolate'-model ziet er als volgt uit.
Van Dissel lijkt hier te zeggen dat de modelleringsresultaten uit China (Wuhan) alleen te verklaren waren door immuniteitsopbouw
De curve van China is als volgt:
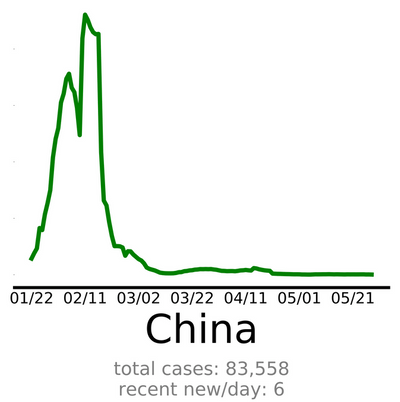
De piek van China overspant een relatief kort durende periode. De abrupte demping, i.e., ontrekking uit het 'Exposed' reservoir, werd hier echter niet veroorzaakt door immuniteitsopbouw, maar door een solide 'track-trace-isolate'-beleid. Ter vergelijking de NL curve:
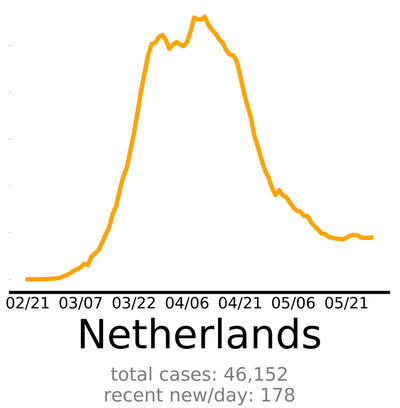
De Nederlandse piek is significant breder dan de piek van China. De Chinezen zijn er in die zin beter in geslaagd het 'Exposed'-reservoir klein te houden. De demping in Nederland door immuniteitsopbouw zal marginaal zijn geweest, aangezien er in slechts 5.5% van de Nederlandse bevolking antilichamen zijn 'aangetoond' door Sanquin.
Ook blijvende immuniteitsopbouw is nog niet bewezen. Indien (snelle) immuniteitsopbouw aan de remming van de ziekteoverdracht zou bijdragen, dan zal dit in de curve van Zweden zichtbaar moeten zijn:
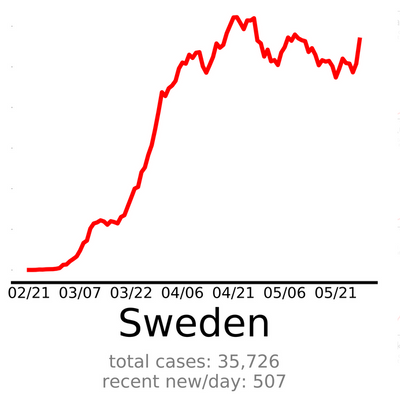
Tot nog toe geeft de curve van Zweden geen enkele indicatie van een snelle overdrachtsremming. Mijn voorlopige conclusie is dat het RIVM in haar op 18 maart gepresenteerde modellering is uitgegaan van een model dat analoog is aan het hieronder nogmaals weergegeven model:
*Infectious Symptomatic = Infectious (Schema - Rode Blok)
Echter een "track-trace-isolate"-scenario lijkt analoog, aangezien in dit scenario ook personen uit het "Exposed" reservoir worden onttrokken en geïsoleerd, waardoor de ziekteoverdracht wordt geremd. het TTI model zal er als volgt uitzien.
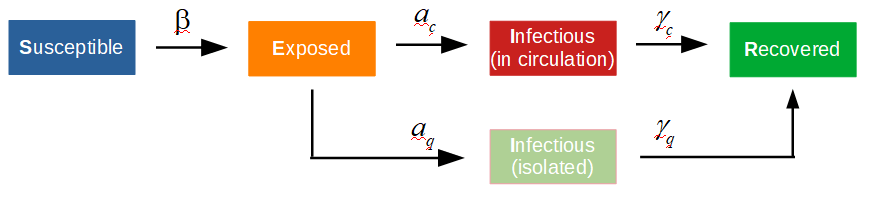
'Infectious (in circulation)' is het aantal vrij rondlopende infectieuze personen en 'Infectious (isolated)' is het aantal personen, die, zowel infectieus zijn als in quarantaine zijn geplaatst.
Het gepresenteerde scenario (slide 7, technische briefing van 18 maart), is afkomstig uit de volgende publicatie: How will country-based mitigation measures influence the course of the COVID-19 epidemic?
In het daarbij gevoegde supplementaire materiaal staat het gebruikte model schematisch weergegeven.
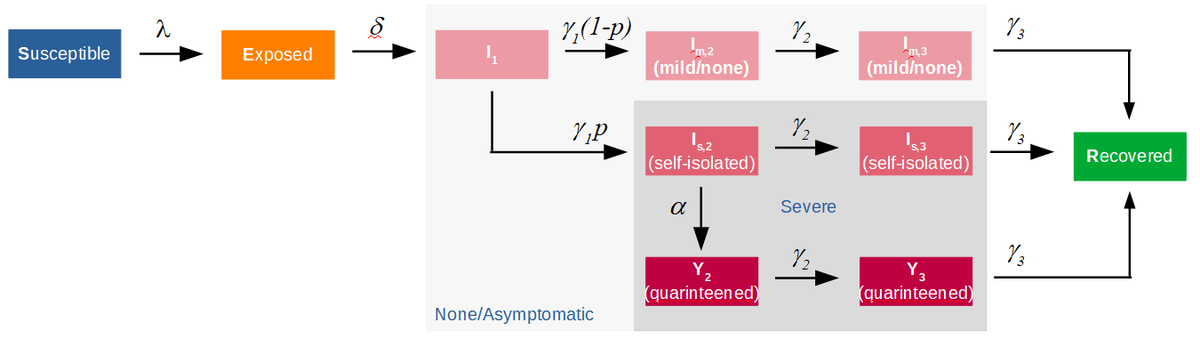
Het model bevat inderdaad een parallele route via asymptomatiche en pauci-symptomatische patienten. Tevens bevat het model de mogelijkheid om zelf-isolatie, waarbij wordt uitgegaan van een lage effectiviteit, en quarantaine te simuleren. Echter alleen voor 'ernstig' zieke patienten.
Kortom, isolatie/quarantaine van asymptomatiche en pauci-symptomatische patienten is niet mogelijk in dit model. In het artikel staat beschreven dat men indertijd uitging van 80% asymptomatiche en pauci-symptomatische patienten, die in dit model niet kunnen worden geisoleerd. Een track-trace-isolate beleid kan met het in het supplement weergegeven model niet worden gesimuleerd.
Indien men dit model heeft gefit aan de wellicht uit Wuhan of Shenzen beschikbare data, zal dit leiden tot parameters die de asymptomatiche en pauci-symptomatische route zullen overdrijven.
Leeftijdscohorten
In het NRC (22-3-2020) staat een nadere beschrijving van de door het RIVM gehanteerde modellen. Er wordt gebruik gemaakt van leeftijdscohorten. Dit betekent dat voor elk leeftijdscohort een epidemiologisch model wordt opgesteld met parameters specifiek voor die leeftijdsgroep. De meeste van deze parameters kunnen uit gepubliceerde of uitgewisselde data worden bepaald/geschat.
Een benodigde ziekenhuisopname kan worden gebruikt als definitie voor een ernstig zieke patiënt. Uit de beschikbare data ten aanzien van ziekenhuisopnames (hieronder weergegeven voor IC), kan per leeftijdscohort het aandeel ernstig zieke patiënten worden bepaald/geschat.
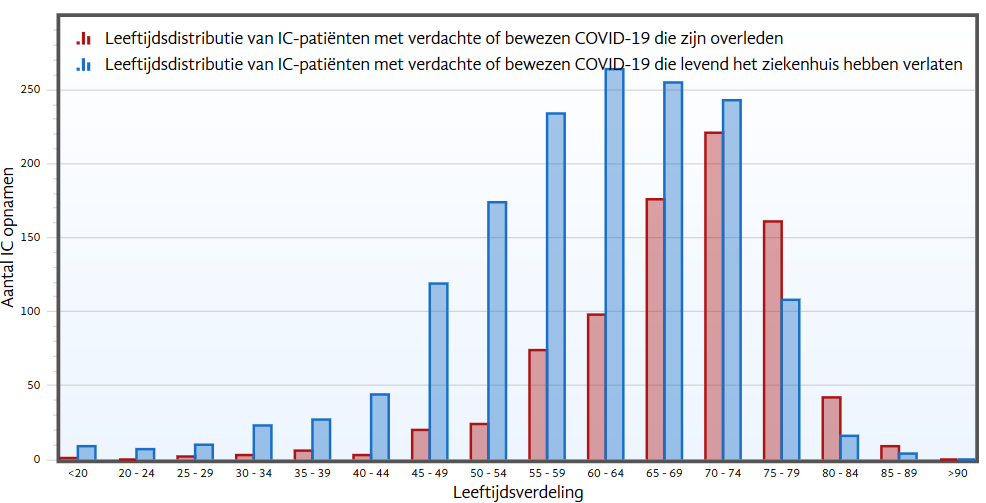
Uit de bovenstaande figuur volgt grof gezegd, dat het ziektebeeld voor de jongere leeftijdscohorten lijkt mee te vallen, voor de oudere leeftijdscohorten is dit echter niet het geval. Daarbij moet nog worden aangetekend dat over de lange termijn effecten weinig duidelijk is op dit moment. Dit lijkt ook niet te zijn meegenomen in de beleidsmatige besluitvorming.
Gechargeerd betekent dit dat het navolgende epidemiologische model de jongere leeftijdscohorten beschrijft.
Voor de jongere cohorten is in het epidimiologische model geen track-trace-en-isolatie (TTI) mogelijk. Dit aangezien er is aangenomen dat het ziektebeeld voor deze cohorten mild is. Het model kent echter geen TTI optie voor dit ziektebeeld. (Orginele bron van grafiek).
Hoop op immuniteitsopbouw?
Uit het opiniestuk 'Test op antistoffen, dat is nu essentieel' van Jaap Goudsmit in het NRC volgt dat er rond 7 april 2020 grote interesse was in de mate waarin de NL-populatie antistoffen had aangemaakt. Ook lijkt de economie te prevaleren over de volksgezondheid: “Hoe sneller het maatschappelijk verkeer weer op gang komt, hoe beter”, onder de experts althans. De serologische tests waren dan ook binnnen ‘no-time’ besteld.
De serologische testresultaten vielen nogal tegen, slechts 5.5% +/- 0.5% had antistoffen aangemaakt in mei (3% in april). Alternatieve immuniteitshandvaten worden nu gezocht, e.g, pre-existente SARS-CoV-2 kruisreactieve T-cellen, e.d.
Het probleem is namelijk dat het nu totaal onduidelijk is hoeveel Nederlanders tot nu toe immuniteit hebben opgebouwd. Wellicht hopen de beleidsmakers en experts nog steeds dat een significant deel van de bevolking immuniteit heeft opgebouwd.
Daarom gaan we nu langzaam interventies opheffen, om te experimenteren of die immuniteit daadwerkelijk is opgebouwd. Met alle risicos van dien. Heeft het RIVM het virus in de vingers?
Aanvulling RIVM COVID-19 modellering
Het RIVM gebruikt eigenlijk een stelsel gewone differentiaal vergelijkingen (behorende bij het SEIR model) voor elk leeftijdscohort. Waarschijnlijk gebruiken ze per leeftijdscohort andere parameters. Dit levert nog meer parallelle routes op.Zodoende kan de verblijftijd in elke container en per leeftijdscohort worden geregeld. Er kan worden aangenomen dat de jongere cohorten een kortere ziekte duur hebben. Hierdoor wordt als het ware een additionele parallele stroom door de jongere leeftijdscohorten gecreëerd. Dit heeft het RIVM waarschijnlijk moeten doen om de scherpe Wuhan te kunnen simuleren. In China werd track-trace-isolate (TTI) toegepast. Dit is mathematisch wat lastig te beschrijven. In het begin zijn er opstartproblemen (hier in NL al 6 maanden), maar als de piek voorbij is wordt TTI steeds efficiënter. Tevens zijn er steeds minder geïnfecteerden. Hierdoor is de afname niet exponentieel maar veel sneller. Het RIVM kon dat goed niet beschrijven met het influenza model.Dit is wellicht ook de verklaring dat men de cijfers uit China niet geloofde.